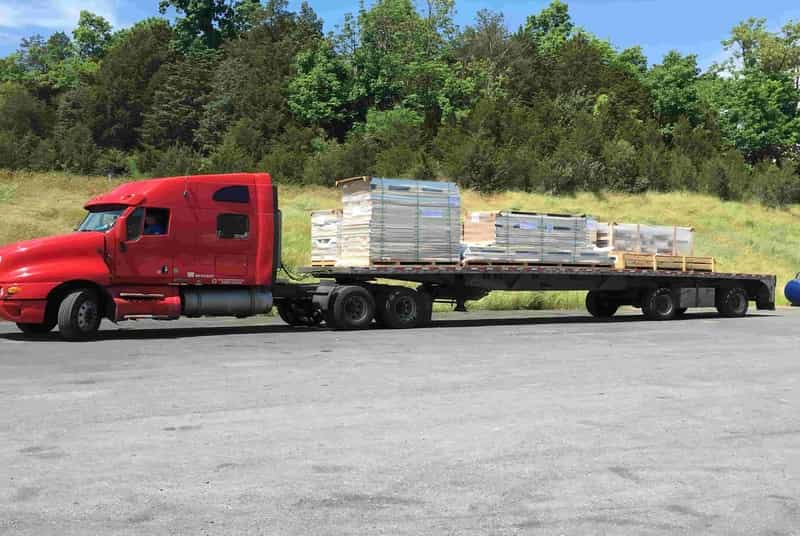
With the tightening of truck capacity over the last year, freight rates have followed suit, and you have probably seen this in the increased cost of shipping walk-in coolers and freezers. In this blog, we are going to help you understand freight costs for shipping walk-ins.
Depending on where you are located, the cost of shipments will vary. It is more expensive to ship to certain areas of the country due to reload availability (how far the truck may need to travel to get another shipment), gas and toll prices, and traffic/difficulty of travel (big cities with heavy traffic and narrow roads make for very difficult).
Freight costs will also vary based on the shipment origin. For example, it is less expensive to ship out of the Fort Worth, TX facility compared to our Piney Flats, TN facility. This is due to the supply and demand in the areas.
Lack of Available Drivers Creating Capacity Constraints
According to the American Trucking Associations (ATA), the struggle to recruit new drivers and keep existing drivers is very real. Carriers are raising driver sign-on bonuses, increasing pay, and providing financial support for potential drivers to attend school, but they are still struggling to increase their driver pool to support the growing demand. The first quarter reported a 6% increase to 94% for the annualized turnover rate for larger full truckload carriers of fleets with more than $30 million in annual revenue. This marks a 20% annual increase. Smaller truckload carriers dropped 7% to 73%, but this is still a 7% annual increase. With unemployment below 4%, this points to drivers finding jobs in other fields paying more and getting them home every night.
Load-to-truck ratios represent the number of loads posted for every truck posted on DAT (Delivered at Terminal) Load Boards. DAT Trendlines provide insight to freight and truckload trends including capacity and rates. The load-to-truck ratio is a sensitive, real-time indicator of the balance between spot market demand and capacity. Changes in the ratio often signal impending changes in rates.
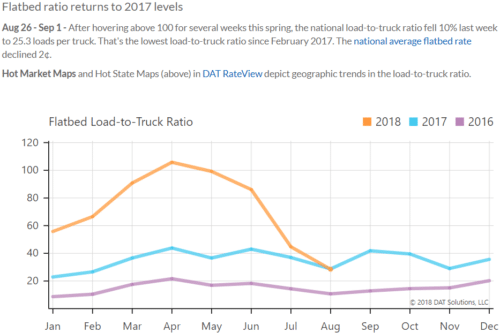
The ratio is an overall national average. The ratio will be higher in smaller areas like Piney Flats, TN, where there is a higher demand over supply, in comparison to larger places like Fort Worth, TX. Also, there is seasonal freight across the country that will pull a lot of the supply and drive the demand up. Seasonal freight traditionally will drive prices up as well. Examples of seasonal freight around our facilities include produce, trees and shrubs, among other products. Along with seasonal freight, there is also government aid freight/rebuilding (freight to support areas hit by hurricanes and/or national disasters). This will pull supply and drive up prices.
KPS Global has seen a decrease in the load to truck ratio over the past two months, but this is still the national average. The Piney Flats, TN location still has a high ratio staying at 100+ to 1 on average.
KPS Global is cognizant of delivery location when evaluating which manufacturing plant to produce walk-in coolers and freezers for our customers to minimize freight. Contact KPS Global now to leverage manufacturing walk-in coolers and freezers from multiple plants across the country.